Or how to look cooler with htop
Htop is a popular command-line tools for monitoring processes. It has some features that seem to be rarely used but could help you with process management or at least make your terminal look cooler.
Help
If you’ve ever wondered what do those weird colors on CPU and memory usage bars mean, the answer is under your F1 button. Here you can see how, for example is actual used RAM marked and how are cached files.

You can find additional options that htop offers. We’ll return to them.
Setup
By default the top part of htop looks more or less like this.

It’s nice, but does not provide any precise information. There are several display options for each bar that can make it more informative:
- Bar – the default
- text
- LED
- graph – this shows the change of certain value over time.
More importantly, you can add more same bars from right menu using arrows and mouse (you can mark one and then drag it with left or right arrows). Of course you can do it with both columns. Below you can see an example config that I brought to a point when it’s a bit of an overkill, but shows how much you can achieve.

Below you have display options for “main” view, a few color schemes (below you can see htop in monochromatic mode):

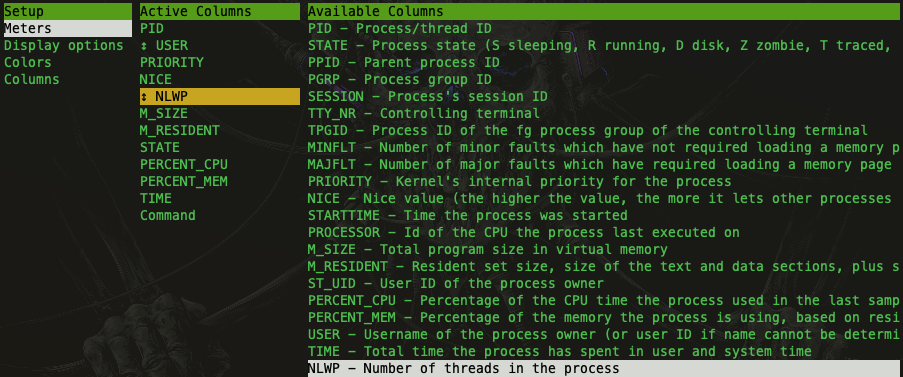
and options what to display on process table. Again the last view allows for adding and deleting columns.
Searching and filtering processes
Pressing F3 enters search mode where you can type searched phrase and it’ll get highlighted. Pressing F3 again brings you to the next occurrence.

F4 on the other hand filters processes that match the phrase. Below Search results for “chrome”:
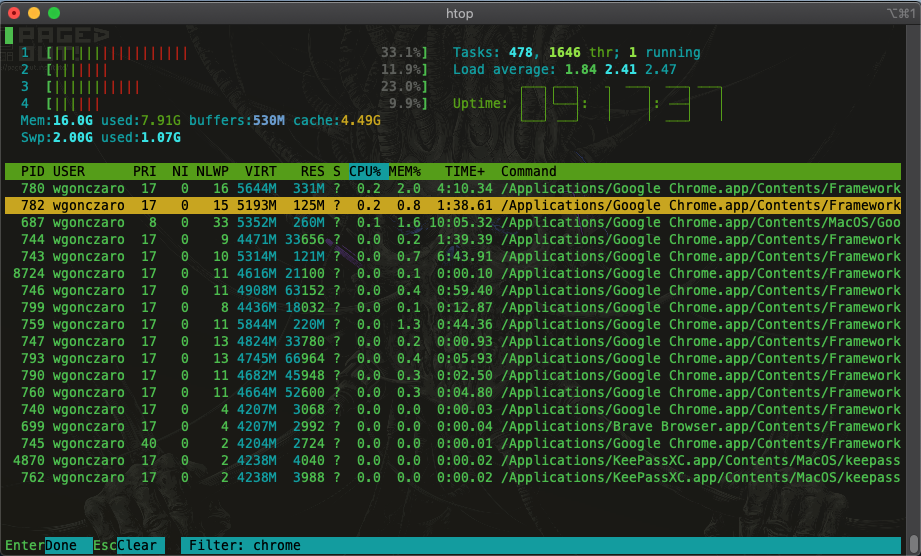
This has some extra features like tagging or showing tree view when T is hit. This allows you to collapse child processes. You can find more options in help menu.
Be nice
Nice is an arbitrary value assigned to a process to modify its priority, of course this is not the only parameter taken into account when assigning CPU time. By default it’s set to 0 which represents neutral value. It can range from -20 to 19 where lower value represents higher priority. Non-privileged users can only increase it making own processes less preferred by the operating system and thus being “nice” to other users. Super users can both increase and decrease nice value. Nice value is displayed in “NI” column.

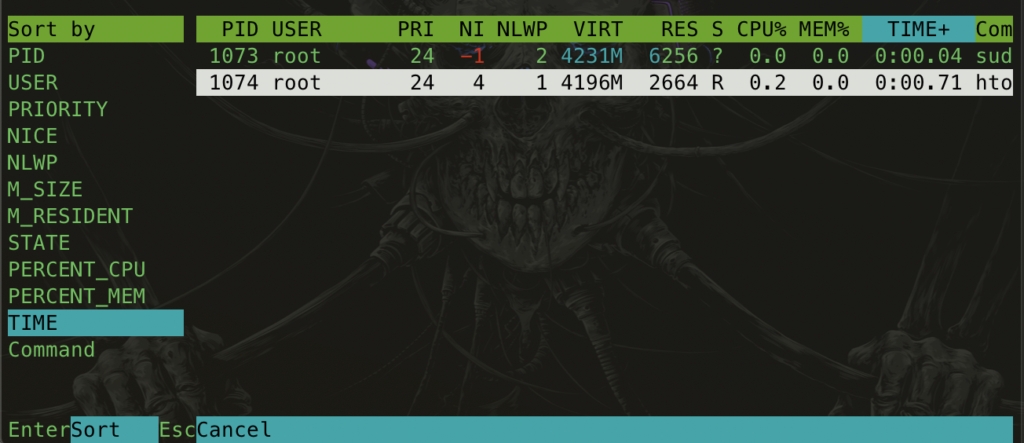
Sorting
Apart from filtering you can also sort your processes by any value displayed on columns. You can do this either by clicking on column header or pressing F6 and choosing proper option.
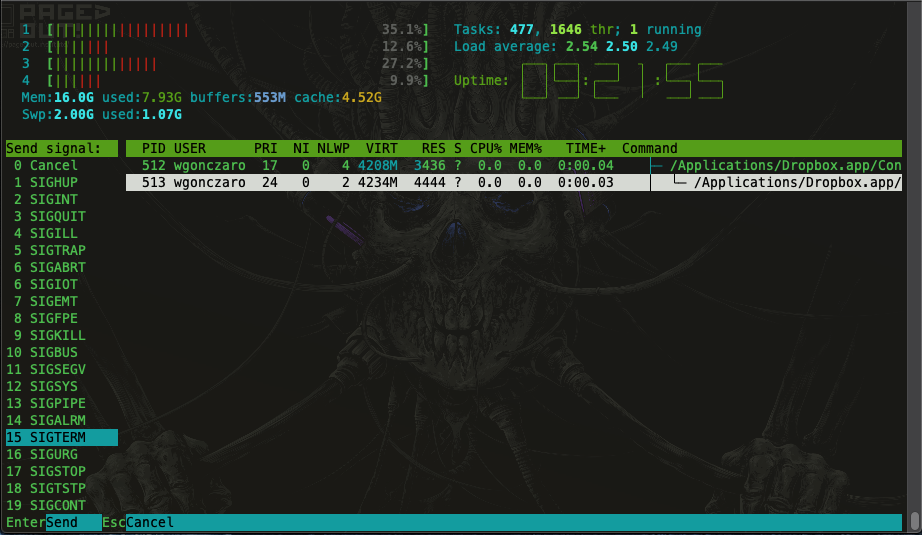
Kill
F9 enters “killing” mode which as you should know allows to send signals to an application. Yes. Unix’s kill command does not terminate a process, it merely send one of 32 signals that can be handled and only some of them cause process to stop.
That’s it. If you liked this article, make sure to subscribe to newsletter and pay me a visit on Patreon.